Faster, More Intuitive, More Useful
Data can be overwhelming – we get it.
With that in mind, we designed a new way to help you quickly and easily access the field data and agronomic tools you need. The update in the web app is live – additional functionality on the mobile app coming soon. We are excited!
There are two ways to get to field data: 1) After opening the app, choose a field to view from the card view. This will open the My Field page with an updated left bar menu. 2) From the map view, click on a field on the map – at the bottom of the pop-up, click on “Show field details->”.
The new left-side menu highlights:
- My Field Summary: A quick view of the soil moisture status and recommendations
- Field Data continuous scrolling: New – check it out! A menu will drop-down to show crop, soil, and sensor data. Once opened, scroll down and watch the maps automatically change as you move from one data type to the next. Lock a layer (in the bottom right legend) to stack field data on the map and observe relationships between layers.
- Monitor your fields with many kinds of agronomic information all in one place:
- Crop type: Shows which crop type is set per crop zone.
- Crop growth: Monitor crop performance and track changes in crop growth with satellite images.
- Soil type: Manually update or upload a soil map, then see a color-coded map with soil types that can be expanded for each zone with depth information if you have entered that data into the system.
- Productivity map: We stack historic satellite data to let you find patterns in your fields.
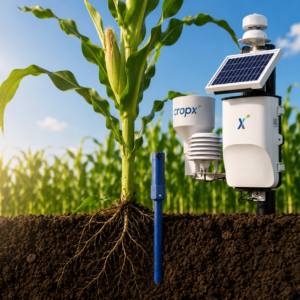
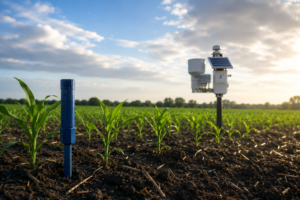
- Sensors: Offers a quick view of current and recent moisture trends and detailed graphs on the profile sum, root zone, moisture (%VWC), temperature and electrical conductivity.
- Coming soon: a new timeline to see historical crop growth imagery
These new features allow crop growth to be tracked across a season by recording planting data, emergence, season end, and the satellite images taken over time.
Lud Uitdewilligen, CropX product manager, has this to say about the updates, “That scroll feature is amazing. That was the first feedback we got. And that was exactly the assignment and focus for our design team: visualize and browse real-time field data in the simplest and most intuitive way. In the next few weeks, we will boost this data stream with more sources like yield-maps or soil scans from connected machines.”